 An Intellyx BrainBlog by Jason English for Opsani
Application performance monitoring (APM) solutions became an essential part of every enterprise-class production environment for good reason.
With critical software becoming ever more distributed and complex, the ability to monitor and alert teams about real-time performance issues happening in production literally governs the success of any attempt to scale. This necessity spurred the first generation of APM tools.
In the early 2000s, every enterprise with a serious web-scale production environment invested heavily in APM tools, starting out with monitoring packages pulling metrics from on-premises servers and VMs, leading to a next generation of website and service-based monitoring and benchmarking tools.
APM could tell you ‘there’s a problem’ — but it couldn’t tell you how to avoid the problem.
Wait, didn’t observability go beyond APM already?
Using metrics, logs and traces from the production infrastructure to observe the inner workings and health of an application, observability rose to prominence over the last decade or so, driven by the needs of cloud-based applications. Observability encompasses APM, and addresses another of its key shortcomings.
Observability can tell you ‘where’s the problem’ – but it still can’t tell you how to avoid the problem by itself.
Observability platforms, when tied to workflows within the enterprise’s ITSM and incident management tools, are starting to form a de facto management suite for assuring application resiliency.
Identifying and responding to issues as they arise in hybrid IT production environments is critical to maintaining application integrity and performance, of course, but we’re still not getting ahead of modern problems by waiting until they have already happened to respond.
Delivering into cloud infrastructure upped the ante on early observability as instances could scale and expand elastically. In particular, deploying cloud-native applications using Kubernetes outstrips almost any sustainable issue response rate, as my colleague Jason Bloomberg highlighted in his latest Intellyx BrainBlog on vertical vs. horizontal scalability:
“Scalability operations in the cloud are slow, on the order of minutes. Kubernetes autoscaling, in contrast, can take place in milliseconds at the pod level.”
If we are talking about hundreds or thousands of ephemeral K8s pods arising and retiring in milliseconds, interpreting the sheer amount of telemetry data returning from all these systems is cost and time prohibitive. Fast, intelligent automation is required to possibly respond to split-second concerns in production.
It’s why the leading observability platforms – and even big application delivery vendors — are investing heavily in acquiring or building out adjacent functionality for getting much earlier insights and even predictive power of the impact of every release.
For example, tying continuous integration and delivery tools with continuous testing, synthetic monitoring, and AIOps for intelligent automated operations are becoming requirements for delivering at cloud-native speed.
Whether developers are checking their own deployments for integrity, or SREs are getting involved to detect misconfigurations immediately after an incident, they want to ‘shift-left’ the optimization of the application and its environment as to track the inflection point of its current quality, performance, and cost trajectories as early as possible in its lifecycle.
Aligning cloud operational priorities with application resiliency goals
We’ve talked to countless enterprise IT shops that are held to arbitrary SLAs (service level agreements) of 5 9’s of uptime, or a fixed compute cost target.
By the time such policies are violated, the root causes of performance problems may have started days or weeks before, and the punitive enforcement and remediation of such compliance clauses will do little to improve customer or employee satisfaction.
Teams are reframing draconian SLAs as more positive, forward-looking SLO (service level objectives) that allow them to set targets on how to get better over time, rather than looking back at what went wrong.
The good old iron triangle maxim of engineering: ‘better, faster, cheaper — you can only pick two’ is about to get thrown out in favor of new solutions that continuously improve performance across every aspect of applications.
Opsani offers a continuous optimization service that takes a novel approach to this challenge, using an automated component called Servo to talk to the deployed Kubernetes application, and create a complete containerized copy of the instance as a tuning pod inside the same namespace.
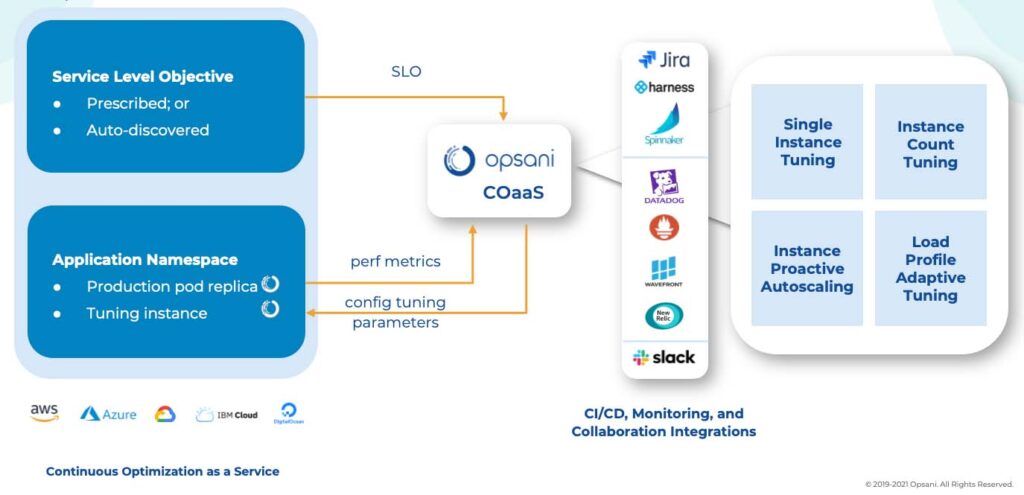
Figure 1. The Opsani service orchestrates tuning pods inside production namespaces that allow AIOps experimentation with replicas, reporting filtered telemetry data and recommendations to the enterprise’s observability tools of choice. (Diagram: Opsani)
The tuning pod is kind of like a sandbox used for experiments by their service’s AIOps routines. It uses the live application as the control group for these experiments as it keeps changing parameters within a rapidly refreshing tuning pod, then reporting impacts to observability platforms and making recommendations to continuously improve the deployment over time.
Redefining the goals
Better: Not just 99.999% uptime or faster response rates – but achieving better resiliency and scalability against peak loads, global network latency and unexpected changes, and ignoring what’s irrelevant to improving performance in the future.
Faster: Not just faster agile feature delivery and quicker deployment cycles. SRE/Ops teams can use automation to hone in on specific tuning issues before and after release, while developers can remain blissfully ignorant of resource utilization concerns, and get more robust pre-optimized features to market with less effort much faster over time.
Cheaper: Rather than looking at the typical TCO and compute/storage cost charts, think of continuous cost improvement as an element of resiliency — since it affects the ROI of the project, and out-of-control costs can kill a business service offering as fast as customer failures. Good cost SLOs in cloud-native environments maximize utilization of hybrid IT capacity, while rightsizing consumption needs and costs, and avoiding the risks of SLA and compliance failures.
Opsani’s approach helps developers strike the balance between allocation and reservation without making them become cloud infrastructure experts. Instead of sizing and reserving instances or hoping cheaper spot market capacity becomes available, they can turn the tables and allow the AI to make optimal horizontal and vertical scaling recommendations, or automate the promotion of some decisions for an increased speed boost.
The Intellyx Take
All organizations ultimately set out to deliver applications better, faster and cheaper.
APM tooling and observability platforms are essential for finding and resolving production issues and successfully delivering performant cloud-native applications, but without an intelligent way to interpret and improve on incoming telemetry data, they can be focused on the past, and still throttle scalability when used alone.
The real reason to measure, understand and respond to changes with intelligent automation early in every software delivery lifecycle is to continuously improve our overall service levels and customer satisfaction over time.
Copyright ©2021 Intellyx LLC. Opsani is an Intellyx customer. Intellyx retains final editorial control of this article. Image credit: Kaius Coolman, flickr CC 2.0 license.