Big data may be exploding all around us, but our brains can only handle so much information at a time. As this divergence continues to grow, it raises the bar on the tools we depend on to present us with the insights we need to get our jobs done.
Both business and technical people face this insight challenge. Business users require visibility into the key performance indicators (KPIs) that both indicate the health of their business as well as problems they must address.
Business intelligence tools of years past generated reports, which met the needs of business users at the time. Today, however, both business and technical users require more insight than reports can deliver, and they need it in real-time.
Dashboards solve some of these problems. They can display real-time information if it’s available, to be sure. But typically, an analyst must set up the desired dashboards ahead of time – both filtering the available information and limiting the ability of users to drill down into specific details depending upon the need at the time.
Furthermore, for operations personnel, dashboards account for only a small subset of the visualizations they work with on a day-to-day basis. Because dashboards display limited information, the real work of ops goes well beyond the scope of such displays – often leaving personnel with blind spots as the quantity of information continues to grow.
For all types of users, in fact, the explosion of available data drives the requirement for new types of visualizations – as well as increasingly powerful abilities to drill down into vast firehoses of data to discern the important insights within such torrents, whether they be business KPIs or critical anomalies that indicate urgent operational problems.
Anoboards: Next Generation Dashboards
When we say ‘drill down’ into large quantities of data, we mean that we want to uncover just the information we require to gain the necessary insight.
For example, a dashboard may indicate a problem with ecommerce conversions (aka ‘purchases’) at a certain point in time. If we drill down, we might find that the real problem is with conversions using a particular kind of credit card for purchases taking place in a particular state, with errors occurring on servers at a particular content delivery network (CDN).
When we’re dealing with vast quantities of real-time data, it becomes increasingly difficult to find such nuggets of insight, given the vast number of permutations of the data that may be in place.
How would we ever have known to look for problems with one credit card type in one state on one CDN? No traditional dashboard would ever point us in the right direction.
Anodot has solved this problem with next-generation dashboards it calls Anoboards. Anoboards don’t simply provide the answer, they indicate the proper question that people should ask. In other words, they point individuals in the right direction for how and where to drill down into available data.
Anoboards empower ops personnel to create customized dashboards that show anomalies for a predefined set of metrics – but only when such anomalies occur. Anoboards are essentially dynamic dashboards that displays only relevant anomalies, allowing drilldowns into real-time correlations and permutations in data.
For example, let’s say you are tracking revenue over time for an ecommerce site, as the Anoboard in the following screenshot illustrates.
The ‘Anomap’ at the top indicates where to drill down to identify underlying issues. The anomalies graph at the bottom automatically points out an anomaly to the expected revenue pattern.
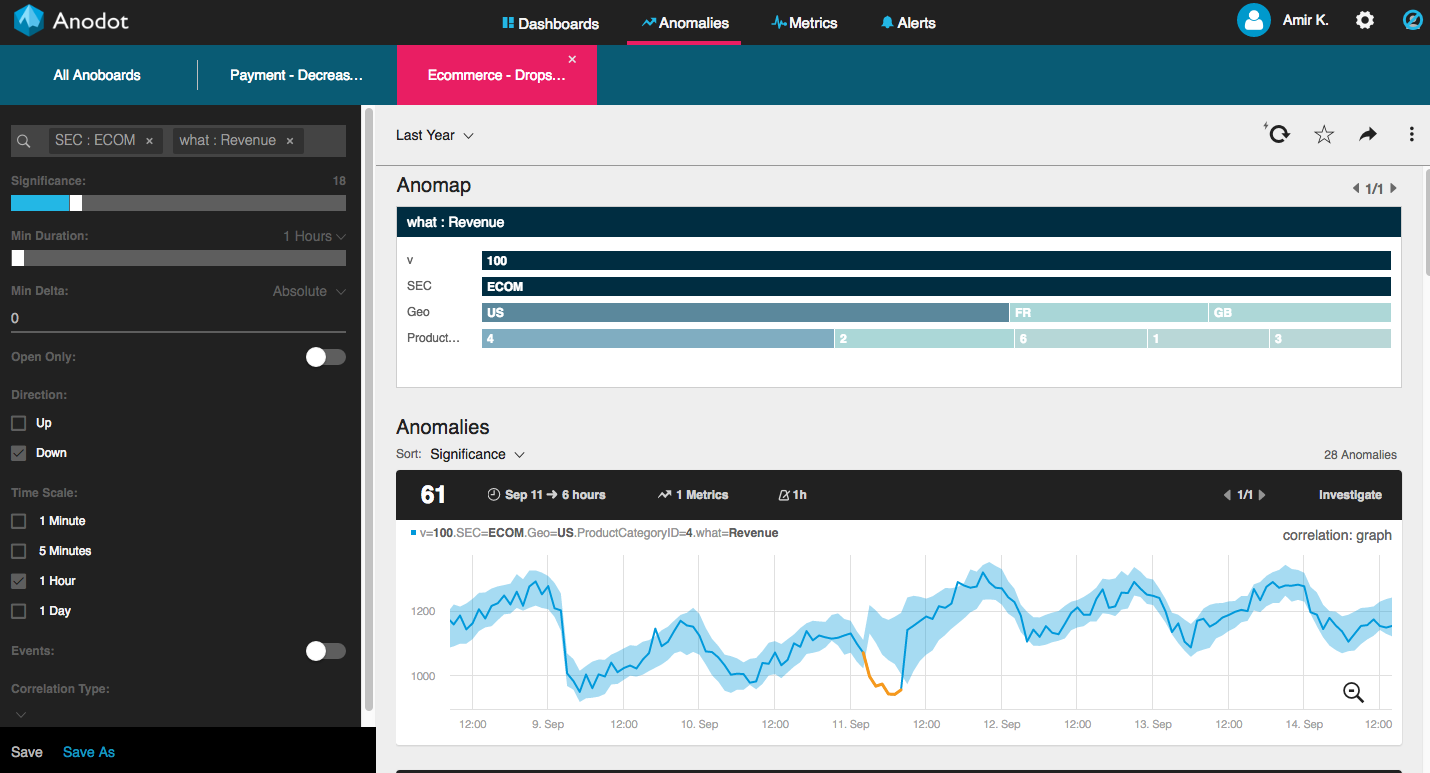 Anoboard Displaying an Anomaly in Revenue (Source: Anodot)
A few clicks later, and the Anoboard displays the underlying anomaly in the payment success rate via one form of electronic payment in a particular geographic location, as the following screenshot illustrates.
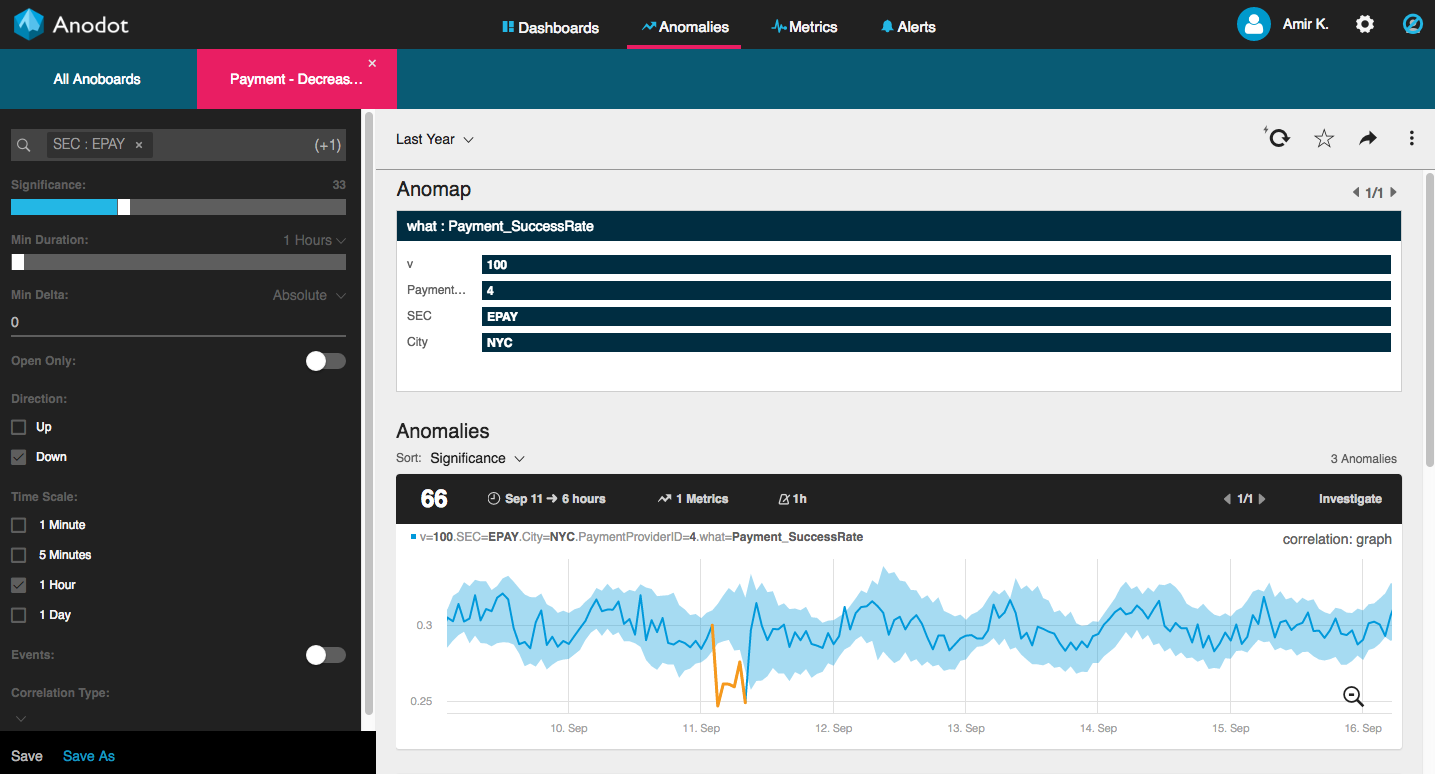
Anoboard Displaying the Underlying Anomaly (Source: Anodot)
The information from the Anoboard above identifies the most relevant information, regardless of the complexity of the data or the number of possible permutations within them – automatically, and in real-time.
The Intellyx Take
Drilling down into massive quantities of data is essential, but everyone needs a starting point to drill down from. To address this need, users can bookmark any particular Anoboard, giving them a way to find any metrics that interest them, or allowing them to return to a particular Anoboard over time.
For example, factory managers might want to view a dashboard of the average machine temperature for the thousands of machines they monitor. If a single machine begins to overheat, that Anoboard would automatically indicate how to drill down to relevant information about that particular machine.
Business executives will likely set up Anoboards to view KPIs like revenue, customer satisfaction, or the like. If one of these KPIs dips, the executive can quickly determine the details of the underlying issues.
Anoboards, therefore, provide insights when and where people need them – and everyone can have their own. In the world of big data, one size never fits all, and Anodot gives any person in any role the ability to drill down to the information they require.
Copyright © Intellyx LLC. Anodot is an Intellyx client. At the time of writing, none of the other organizations mentioned in this paper are Intellyx clients. Intellyx retains full editorial control over the content of this paper.